

On Friday, M&T Bank Corporation (MTBMTBM&T Bank Corporation$218.65+1.20% Valuation Verdict Fairly Valued ) reported third-quarter results that beat adjusted EPS expectations but narrowly missed the consensus revenue estimate. M&T’s adjusted diluted EPS was $5.08 compared with Finnhub’s $5.01 consensus, about 1.4% above expectations.
Diluted EPS of $5.04 was in line with GAAP. It did clear $5.01, but that estimate matches the adjusted number so I’m going with that one.
There is one proviso before you say it’s clean. The estimate data from Yahoo is not available yet, and the two vendors disagree in about one out of nine (beat versus miss). I would cling to the label for the time being with 7 cents of cushion.
Sequentially, it’s a softer print. Adjusted EPS was down 5% from $5.35 in Q2, though still up 4% y/y from $4.87, per the 8-K. Net income came in at $775 million. That’s lower than the $818 million recorded in Q2, and the $792 million recorded a year ago.
Unfortunately, M&T does not report total revenue in their release, so I’m leaving the two items separate. Net interest income of $1,793 million was essentially unchanged from $1,792 million in Q2 but higher than $1,761 million in the same period a year ago. Noninterest income amounted to $743 million compared with $740 million in Q2 and $752 million in Q2 a year ago.
The Street did include a number for revenue as a whole (it isn’t a line in the release). The reported $2.55 billion was 0.4% lower than its expectation of $2.56 billion. A miss, but barely.
Returns came down. Annualized ROA was 1.40%, versus 1.51% in Q2 and 1.49% a year ago. Return on average common equity was 11.44%, against 12.30% last quarter and 11.45% in 3Q25.
It was the other way around when it came to costs. Noninterest expense increased by 3% q/q to $1,393 million and the efficiency ratio was 54.4% compared to 52.8%. Management attributes the increase to outside data processing and software, professional services and an additional working day.
The margin didn’t, loans grew.
The growth in the loans was reflected. Average loans increased $2.6 billion in the quarter, of which $1.6 billion was due to commercial real estate, and $2.1 billion to consumer and residential real estate. Average total loans were 2% higher, q/q, and 5% higher, y/y, and average interest-bearing deposits increased $3.5 billion.
CFO Daryl N. Bible summed up the quarter this way: “M&T’s third quarter results were highlighted by strong loan and deposit growth, stable credit and a solid capital position.”
The half deposit is an average balance story, though. Total deposits at September 30 of $167,510 million were slightly below the $168,885 million at June 30. The value of noninterest-bearing deposits decreased from $48,295 million to $44,819 million. I’d want to know what’s the difference between the average and the picture at the end of the period.
So did the margin hold? Not quite. Net interest margin fell to 3.65% down from 3.70% in Q2 (3.69% a year ago) while the cost of interest-bearing liabilities increased to 2.44% from 2.36%. The release reports that taxable-equivalent net interest income actually increased just a little, with an additional day accounting for some of the increase, but interest income on nonaccrual loans offset some of that gain.
But I’d say that there’s a little bit of pushback I’d have on “stable” when it comes to credit. The annualized net charge-offs rate was 0.35% of average loans, compared with 0.23% in Q2. That translates to $127 million compared to $80 million in dollars. It’s still lower than it was a year ago at 0.42% anyway.
The remaining part of the credit table is mixed. The number of nonaccrual loans increased 7% to $1,298 million and the provision for credit losses increased to $135 million from $120 million. The allowance was slightly reduced from 1.53% of loans to 1.51%.
Capital was almost unchanged q/q. The estimated CET1 ratio was 10.16%, down from 10.19% at the end of Q2 but up from 10.99% a year ago. Buybacks diminished: M&T bought back 1.3 million shares worth $323 million in the quarter, versus $465 million in Q2.
No comments, no anticipated play
It’s not like you can compare it to anything. It doesn’t include forward guidance and the July 15 release lacked any such guidance for this quarter either.
There was also no reported move in option-implied moves in the lead up to the print. Well, I don’t know if it’s more or less than what the market was expecting, and I’m not gonna speculate.
The reaction so far, and the history behind it
It’s not official, as the first regular session following the report is not yet closed. At 9:15 am ET the stock was at $215.30 in pre-market trading, down 1.5% from the $218.65 close on Oct. 15, in thin trading.
That’s 0.65 times the stock’s 12 report average one-day range of 2.4%. Smaller than usual thus far.
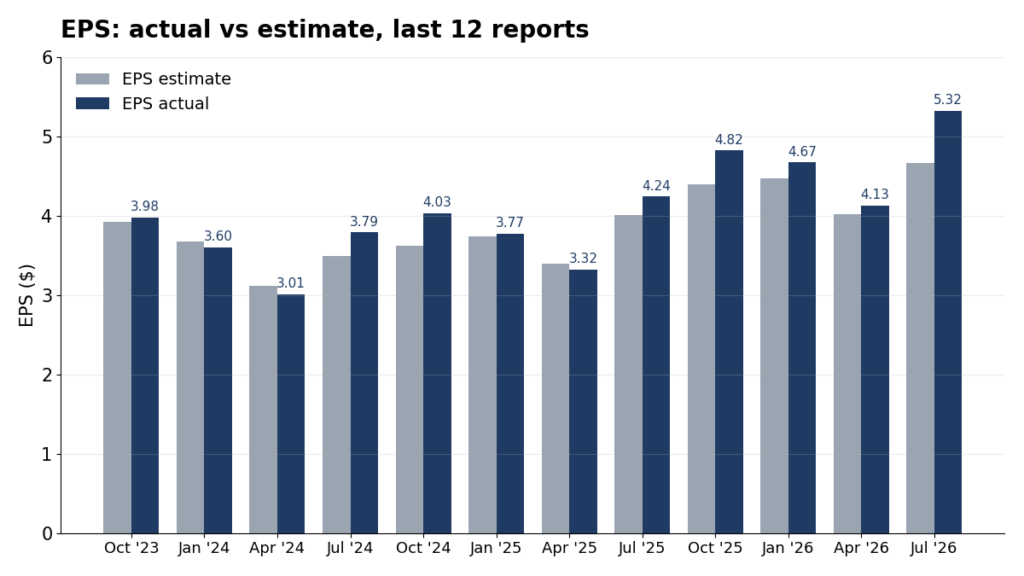
Surprises me, dip after a beat? Not with this stock! M&T beat EPS expectations in 9 of its last 12 reports., and M&T fell the following day after 6 of the 9 out performances. From July 2025 to April 2026 four of them returned. The streak was ended by July, when the beat was 14.2%, and the gain was 2.8%.
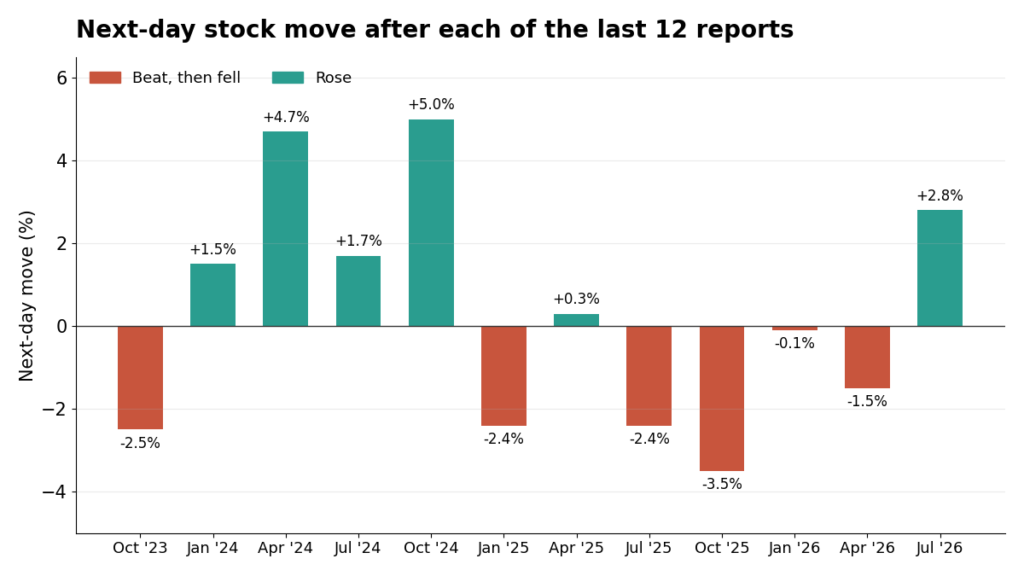
It’s not the drops that interest me, it’s what came after those drops. Five of the beat-and-fell reports have daily price data. In all five, the stock was up five sessions after the first day’s close, ranging between slightly more than 0.2% to 1.7%.
Four of the five sessions were still available, 20 sessions out. April 2026 was the odd one out at -6.0%. Five cases are not enough to be based on, so I would just call this an observation.
The stock wasn’t coming in strong either. It closed at $218.65 on Oct. 15, up 10.0% year to date but down 12.3% over three months. That left it 14.6% under the 52-week high of $255.95.
Peers which have already reported do not provide a clean read. PNCPNCThe PNC Financial Services Group, Inc.$214.94-0.40% Valuation Verdict Fairly Valued held up by 2.4% on Oct. 15, and fell 0.4% on Oct. 16, when it normally moves by ±1.9%. USB missed by 0.1% the same day and still rose 2.0% (its usual is ±2.4%). TFC posted a 3.7% beat on Oct. 16 and its next-session jump is yet to be measured. All three sets of numbers are tentative.
Valuation and analysts who are continually cutting
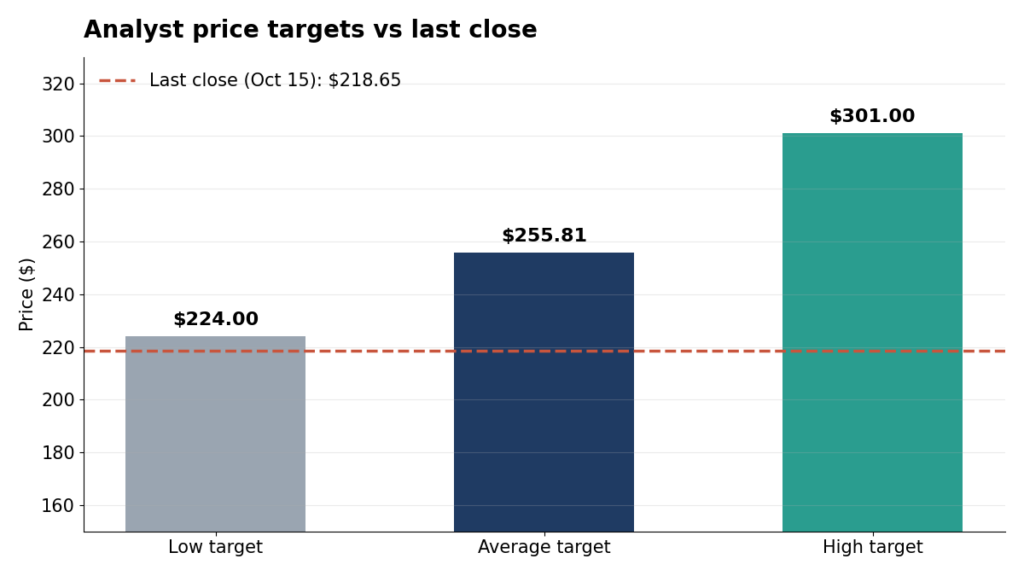
M&T trades at 11.7x trailing earnings and 10.4x forward, and has a market value of approximately $31.58 billion. The 18 analysts on average have a target of $255.81, 17.0% above the last close. The range of targets is $224.00 to $301.00, which is still above where the stock closed on Oct. 15.
Sentiment data is both attracting and repelling. The rating mix is better today with 6 buys, 15 holds and 1 sell compared with three months ago when it was 4 buys, 15 holds and 1 sell. There is still no agreement.
However, the goals have been on the decline. Analysts reduced estimates by five times over the past 30 days, while there were no improvements or downgrades.
The cuts were spread around. Evercore ISI lowered its estimate to $230 from $260, while Truist Securities lowered its estimate to $250 from $268. JP Morgan moved to $248.50 from $265.50, and UBS to $238 from $255. Morgan Stanley just lowered its rating from Overweight to $301 from $304. The most recent was when Raymond James began coverage at Outperform with a $250 price target on Oct. 7.
The more that buy ratings go up, the more that price targets go down. That’s what I have a problem with – the imbalance. There’s been no sell or buy in the open market in the past 90 days, either, according to insiders.
Before making your next move, analyze the stock in detail. See what the fundamentals suggest, where momentum is building or weakening, how the company compares against competitors, and whether insiders are buying or selling into the current trend into a single report in seconds.
What I’m up to next
The first question will be the easiest one. Does this complete session validate the pre-market dip or is this another July?
Then the fundamentals. With the cost of interest-bearing liabilities now at 2.44%, can the margin maintain its level around 3.65%? Nonaccrual loans increased 7% as well, is the step-up in charge-offs 0.35% a one-quarter bump? But do the period-end deposits keep up with the growth management that is based on the average balance, especially for the noninterest bearing variety?
Round it out are capital and sentiment. Now that CET1 is at 10.16% and buybacks have been reduced to $323 million, will the pace of buybacks return? With five target cuts in the past 30 days, do analysts continue to cut after viewing the quarter?
Discussion & Perspectives
Join the conversation and share your valuation thesis or technical insights.
Sign in to join the discussion
Only verified Tickzen members can publish comments and share research perspectives.
Loading comments…