

The Timken Company (NYSE: TKR) has delivered a 25 percent gain in just 15 trading days heading into June 2026. At $137.09, the stock is sitting near its 52 week high of $139.43, and every momentum indicator is flashing green. That is exactly when an investor needs to slow down. This TKR stock technical analysis breaks down the chart, the key price levels, the overbought signals, and what the data says about whether right now is the right time to buy, wait, or trim.
The Rally in Numbers
From the May 18, 2026 close of $112.37, TKR ran to $134.67 by June 8, posting a 19.85 percent gain across 15 trading sessions. The stock traded between $107.15 and $136.59 during that stretch, with average daily volume of 1,176,193 shares.
For context, TKR has outperformed every major benchmark over the past year: up 87 percent versus the S&P 500 at 22.6 percent, the Nasdaq 100 at 34.1 percent, and the sector ETF XLI at 22.1 percent. Year to date the outperformance gap versus the S&P 500 is 49.1 percentage points.
That kind of run does not happen randomly. The catalyst trail is clear: Q1 2026 earnings beat on May 6, the Investor Day on May 20 where 2028 targets of 21 to 23 percent EBITDA margins were unveiled, and a JPMorgan upgrade to Neutral that followed. Price follows news, and TKR has had real news to price in. But TKR stock price prediction models at this point have to grapple with one central question: how much of that news is already in the stock?
The Trend Is Still Bullish. The Momentum Is Stretched.
TKR is trading above both the 50 day SMA at $113.08 and the 200 day SMA at $93.36. That moving average alignment is textbook bullish. The 20 day SMA at $128.55 has held as dynamic support throughout the recent leg higher.
The MACD histogram is positive at 0.88, which confirms ongoing short term upward momentum. These indicators, taken together, would give the all clear on direction.
But the RSI at 74.0 is a complication. Any reading above 70 is technically overbought, and 74 is meaningfully into that territory. When RSI crosses 70 to 75 on a stock that has moved 25 percent in two weeks, history tends to show a period of consolidation or a modest pullback before the next leg higher begins.
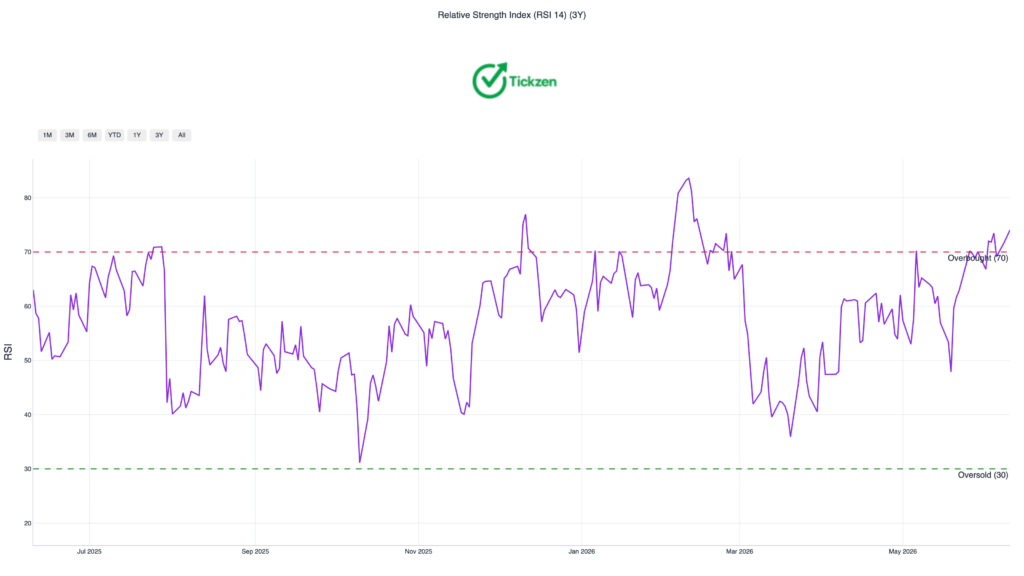
The critical distinction for a TKR stock buy or sell decision: overbought does not mean broken. It means the stock needs time or price to digest the move. A healthy trend can stay overbought for weeks. A weak trend fails immediately at those levels. With institutional ownership at 95.47 percent and a genuine earnings beat behind this rally, this is not a weak trend.
More From Tickzen:
- American Airlines Stock (AAL) Technical Analysis 2026
- Is IREN Stock Overvalued at $61? What the Numbers Say Before You Buy
- EchoStar SATS Stock Analysis 2026: Is the 7x Rally Running Out of Steam?
- FuelCell Energy, Inc. (FCEL) Technical Analysis 2026: 12-Month Forecast & Key Risks
- TKR Stock Analysis 2026: Why Timken’s 80/20 Strategy Is Changing the Investment Case
Volume Is the Missing Piece
The one technical concern that overrides the bullish setup is volume. The recent rally ran on flat to below average volume relative to the 20 day average. Healthy continuation moves are typically accompanied by expanding volume on up days. When a stock gains 20 percent on average or below average volume, it raises the question of whether conviction is building or whether the move was driven by short covering and momentum chasing.
Short interest sits at 3 million shares, representing 4.58 percent of float with a days to cover ratio of 2.6x. That is moderate but not extreme. A short squeeze is not the full explanation for the rally, which makes the low volume more notable, not less.
For the TKR stock forecast to play out cleanly, the next move above $137 needs to come with volume expansion. Without it, the probability of a consolidation phase before the next leg up increases.
Key Price Levels Every Investor Should Know
Immediate support: $128.55 This is the 20 day SMA. As long as TKR holds above this level, the short term bullish structure remains intact. A daily close below $128.55 would weaken the trend and open the door to a test of deeper support.
Major cluster support: $113.19 This price level has been tested five times in recent trading and held each time. A breakdown below $113.19 would be a genuine bearish signal, not just routine volatility.
Flipped resistance to support: $116.81 This was tested six times as resistance before the breakout. It has now flipped to support. Any pullback that holds this level would be a constructive setup for buyers.
Upside trigger: $140.63 A sustained move above the 52 week high zone with strong volume would validate continuation toward analyst targets in the $150 to $158 range. Without volume confirmation at that breakout, the risk of a false breakout increases.
Long term anchor: $93.36 (200 day SMA) This is the floor for the long term uptrend. Long term investors should treat any pullback that holds above this level as a buying opportunity within a structurally bullish setup.
Volatility and Risk: Do Not Ignore the Numbers
TKR carries a 30 day historical volatility of 40.2 percent, well above the full history average of 30 percent. The beta is 1.23x, meaning the stock moves about 23 percent more aggressively than the broader market in both directions. That is not a quiet industrial stock. That is a stock that can move 5 to 8 percent in a single session on the right catalyst.
The options market is pricing this in. The nearest expiry implied volatility sits at 53.3 percent, which maps to a straddle implying a plus or minus 13.5 percent move by July 17, 2026. That range means the market sees a potential trading range of roughly $118 to $156 before mid July. The put call ratio of 0.44x leans bullish (more calls than puts), which aligns with the positive sentiment reading.
For position sizing, these volatility numbers matter. A 2.70 percent daily Value at Risk at the 5 percent confidence level means on a bad day, a large position moves hard.
Three Investor Profiles, Three Different Answers on TKR Stock Buy or Sell
Short term traders: The RSI at 74 and weak volume on the rally are real caution flags. Taking partial profits near current levels and waiting for a pullback toward $128.55 gives a better risk reward for the next trade. A confirmed hold above $128.55 after a pullback is a cleaner entry than chasing the stock at $137 with an overbought oscillator.
Swing traders: Watch the $140.63 level. A clean breakout above the 52 week high on meaningfully above average volume is the signal to add exposure. Without that confirmation, patience is the position.
Long term investors: The 200 day SMA at $93.36 defines the long term trend. That trend is firmly intact. For investors with a 12 to 24 month horizon, any pullback toward the 50 day SMA at $113.08 or the $116.81 support zone is a higher conviction entry than buying at $137 with RSI elevated. The Timken stock momentum and earnings growth story does not require buying at the top of a short term run.
Want to see whether this stock is still a buy at current levels? Run the full analysis to check fair value estimates, insider activity, technical signals, options positioning, support and resistance zones, and what analysts are expecting next in seconds.
The Bigger Picture on TKR Stock Price Prediction
Analyst targets range from $120 to $158. The median consensus sits at $140. Evercore ISI holds the highest target at $158 with an Outperform rating, citing the 80/20 strategy and the 2028 margin roadmap. The July 29, 2026 earnings report is the next real test of whether Q1 momentum extended into Q2.
The Timken stock technical analysis does not say avoid the stock. It says the current moment is not the optimal entry. The trend is real. The earnings beat was real. The 2028 targets are ambitious but grounded in actual portfolio actions. The technicals simply suggest that buying at a 52 week high with an overbought RSI and low confirming volume is a lower probability trade than waiting for a better setup.
This article is for informational purposes only and does not constitute investment advice. Always conduct independent research before making investment decisions.
Comments
Join the discussion and share your view on this insight.
No comments yet. Be the first to contribute.