

QCOMQCOMQUALCOMM Incorporated$204.13-8.01% Valuation Verdict Fairly Valued stock has surged 18.39% in 15 days — but technical signals are flashing caution. Here’s the complete QUALCOMM stock technical analysis for 2026.
In just 15 trading days — from April 6 to April 24, 2026 — QCOM stock surged 18.39%, climbing from $125.73 to close at $148.85. For a $158 billion company in the semiconductor space, that’s an extraordinary move. But here’s the thing about extraordinary moves: they demand extraordinary scrutiny before you chase them.
If you’re asking yourself whether QCOM stock will go up or down in 2026, this QUALCOMM technical analysis breaks down every key signal — RSI, MACD, Bollinger Bands, moving averages, volume, support and resistance levels, and what the options market is implying about near-term volatility.
QCOM Stock Price Analysis: Where Is QUALCOMM Trading Right Now?
As of April 27, 2026, QCOM is trading at $148.85 — sitting in what technicians would call a classically transitional position:
- Above the 20-day SMA ($135.91) ✅
- Above the 50-day SMA ($134.57) ✅
- Below the 200-day SMA ($156.55) ❌
This moving average alignment is the single most important fact in the QUALCOMM technical picture right now. When a stock trades above its short-term averages but below its long-term 200-day moving average, it creates what traders call a “mixed trend” — a no-man’s land where neither bulls nor bears have definitive control.
The 200-day SMA at $156.55 is the line in the sand for QCOM bulls. A sustained close above that level would represent a major technical breakout and dramatically shift the long-term trend from bearish to bullish. Until that happens, caution is warranted.
QCOM RSI Analysis 2026: Overbought Signal Flashing Red
The 14-day Relative Strength Index (RSI) for QCOM is currently at 73.4 — firmly in overbought territory (anything above 70 is considered overbought by traditional technical analysis standards).
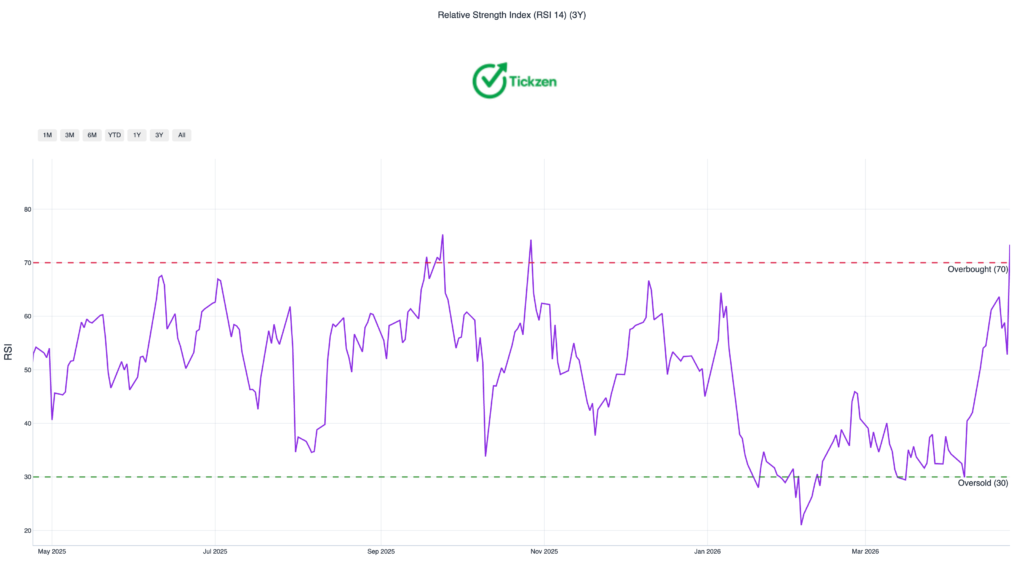
What does an overbought RSI actually mean for QCOM stock? It doesn’t mean the stock will crash tomorrow. What it does mean is that the recent buying pressure has been intense enough that a pause, consolidation, or short-term pullback becomes statistically more probable before the next leg higher.
Historical Precedent for RSI Overbought at This Level
When QCOM’s RSI has crossed above the 70-75 range in previous cycles, the typical pattern has been a cooling period followed by a base-building phase before continuation — if the underlying fundamentals support it. The critical question is whether QCOM’s recent momentum has legitimate fundamental backing (positive earnings expectations, sector rotation into semiconductors) or whether it’s purely momentum-driven.
Trading implication: Aggressive traders who rode the 18.39% move may consider taking partial profits at current levels. Conservative traders should wait for RSI to cool below 70 before initiating new positions in QCOM stock.
QCOM MACD Analysis: Bullish Signal, But Read It Carefully
While the RSI warns of overbought conditions, the MACD (Moving Average Convergence Divergence) tells a different story: it’s showing a bullish short-term trend with a current reading of 1.86.
A positive MACD histogram means short-term momentum remains upward — the 12-period EMA is still above the 26-period EMA, and the signal line hasn’t crossed bearish. For QCOM stock traders, this is the most encouraging near-term signal in the current technical setup.
The interplay between an overbought RSI and a bullish MACD is actually a classic setup in technical analysis — it’s telling you that momentum is real, but the move may be getting stretched. Volume confirmation becomes critical here: if QUALCOMM’s price continues higher on expanding volume, MACD stays your friend. If volume dries up while price pushes higher, MACD divergence becomes a risk.
QUALCOMM Bollinger Bands Analysis: Walking the Upper Band
The QCOM stock price is currently trading above the upper Bollinger Band at $143.03 — a phenomenon technicians call “walking the band.”
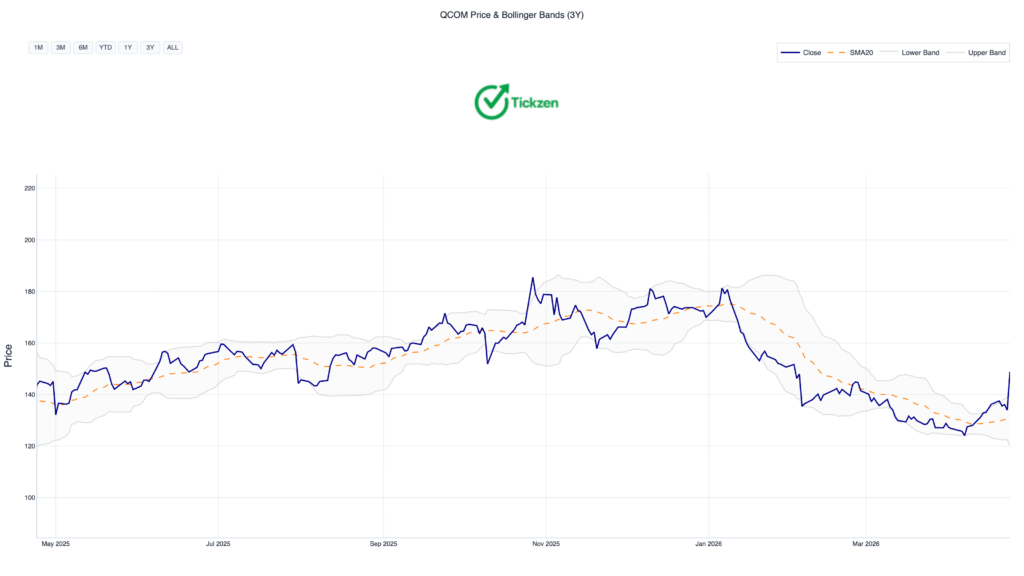
Here’s what that means in practice: Bollinger Bands represent two standard deviations from a moving average. Prices close above the upper band are statistically unusual, occurring in fewer than 5% of normal trading sessions. When a stock “walks the band” — trading above it for multiple consecutive sessions — it can signal either:
- Genuine trend breakout — the stock is establishing a new, higher trading range
- Rubber band effect — price has stretched too far from its mean and is due for a snapback
For QUALCOMM stock in 2026, the distinction matters enormously. The lower Bollinger Band sits at $119.96 — which represents roughly 19.4% downside from current prices if the rubber band snaps back hard. That’s not a prediction, but it’s a risk range traders need to respect.
QCOM Support and Resistance Levels: The Map for Traders
Understanding QUALCOMM’s key price levels is essential for anyone actively trading or looking to establish a position:
Key Resistance Levels
- $148.85 (Current Price) — Immediate psychological level
- $150.10 — Analyst consensus mean price target, representing a wall of expectations
- $151.54 — Recent 15-day high (April 24, 2026)
- $156.55 — 200-day SMA: the major long-term resistance that defines QCOM’s macro trend
Key Support Levels
- $143.03 — Upper Bollinger Band (now potential support if held)
- $135.91 — 20-day SMA: the critical near-term support level
- $134.57 — 50-day SMA: secondary support
- $128.81 — Cluster resistance/support level (tested 9 times)
- $125.35 — Strong cluster support (tested 9 times): the “line in the sand” for bears
The Trading Plan in Plain English
If QCOM holds above $135.91: Bullish trend continues. The stock can explore higher prices with the 200-day SMA at $156.55 as the next major target.
If QCOM breaks below $135.91: Expect a dip toward the 50-day SMA at $134.57. Not catastrophic, but a warning sign.
If QCOM drops below $125.35: This would be a serious breakdown signal. A deeper correction toward the 200-day SMA — and potentially toward the 52-week low of $121.99 — would become likely.
More From Tickzen –
- Is QCOM Stock a Good Investment in 2026? QUALCOMM Stock Analysis Reveals a Complex Picture
- Intel Stock Technical Analysis 2026: RSI at 82, a 63% Surge, and What Traders Should Do Next
- INTC Stock Analysis 2026: Is Intel Worth Buying After a 63% Rally?
QCOM Historical Volatility and Beta: Know Your Risk Before You Trade
QUALCOMM stock is not a boring, low-volatility defensive play. The numbers make this clear:
- 30-Day Historical Volatility (Close-to-Close): 42.9% — significantly above QCOM’s full-history average of 31.6%
- Beta: 1.28x — QCOM moves approximately 28% more than the broader market on average
- 30-Day Parkinson Volatility: 25.5% (intraday range-based measure)
- Maximum Drawdown: -44.29% (historical worst-case decline)
The Value at Risk (VaR) at 5% confidence shows a potential single-session loss of -2.86% in the worst 5% of days. At the 1% confidence level, that rises to -6.02%. Translated to dollar terms at $148.85: a 6% move represents approximately $8.93 per share.
For position sizing purposes, QCOM is a stock where disciplined risk management matters more than most. The Sharpe Ratio of 0.29x and Sortino Ratio of 0.39x suggest the risk-adjusted returns have been modest, meaning you’re not being adequately compensated for the volatility — at least in recent history.
QCOM Stock Performance vs. Benchmarks: The Uncomfortable Truth
One of the most striking data points in the entire QUALCOMM technical picture for 2026 is benchmark underperformance:
| Benchmark | QCOM (1-Year) | Benchmark (1-Year) | Gap |
|---|---|---|---|
| S&P 500 | +2.5% | +29.7% | -27.1% |
| NASDAQ 100 | +2.5% | +40.5% | -38.0% |
| Dow Jones | +2.5% | +22.7% | -20.2% |
| XLK (Tech ETF) | +2.5% | +54.6% | -52.0% |
QCOM has returned just +2.5% over the past year while the NASDAQ 100 has surged 40.5%. Year-to-date, QCOM is down 13.4% while the S&P 500 is positive.
That’s not a rounding error — that’s significant structural underperformance. The question for 2026 is whether QUALCOMM’s recent 18.39% bounce is the beginning of a genuine catch-up trade, or a relief rally in an ongoing downtrend. The 200-day SMA at $156.55 remains the definitive answer to that question.
QCOM 52-Week Range: What the Price History Tells Us
QCOM’s 52-week trading range spans from $121.99 to $205.95 — a spread of nearly $84, or roughly 69% of the current stock price. This wide range tells a story of dramatic sentiment swings:
- The $205.95 high represents peak optimism — likely tied to AI and 5G growth narratives
- The $121.99 low reflects peak pessimism — where capitulative selling brought in value buyers
- At $148.85, QCOM is trading at roughly 26% below its 52-week high and 22% above its 52-week low
This mid-range positioning means QCOM isn’t obviously cheap (near 52-week lows) or obviously expensive (near 52-week highs). It’s in the ambiguous middle — exactly where technical analysis earns its keep.
What the Options Market Is Saying About QCOM Stock
The options market offers a real-time read on market-implied volatility and expected price movement — and for QCOM, the signals are significant.
The nearest-expiry implied move for QCOM is ±13.0% (±$19.4) around the May 29, 2026 expiration (32 days away). This straddle pricing tells you that options traders are collectively pricing in a roughly $129.45 to $168.25 range for QCOM over the next month.
The upcoming April 29, 2026 earnings report is the dominant driver of that elevated implied move. Earnings announcements for semiconductor companies regularly produce 8-15% single-session moves in either direction. QCOM’s implied move is consistent with a market expecting a significant earnings-related swing.
Put/Call Ratio of 0.19x is notably low — suggesting that call buying is overwhelmingly dominant relative to put buying. This is consistent with the cautiously positive sentiment composite score of 0.19x, with options sentiment rated as Positive (0.62x). However, extremely low put/call ratios can sometimes signal complacency rather than genuine bullishness.
QUALCOMM Stock Short Interest: A Potential Catalyst
Short interest in QCOM stock has increased materially — jumping from 40 million shares the prior month to 49 million shares (5.10% of float) as of April 15, 2026. The days-to-cover ratio stands at 3.80x, meaning it would take short sellers nearly 4 days of average trading volume to fully cover their positions.
This elevated and rising short interest creates an asymmetric setup around the April 29 earnings report. If QUALCOMM delivers a positive earnings surprise — which the forward P/E of 13.51x versus trailing P/E of 30.01x certainly implies the market is expecting — a rapid short covering episode could amplify any upside move significantly.
Short squeezes in semiconductor stocks with this level of short interest have historically produced 10-20% rapid moves. It’s not a base case, but it’s a scenario worth having on your radar.
QCOM Stock Technical Analysis Summary: The Final Scorecard
Here’s the honest technical summary for QUALCOMM stock in 2026:
Bullish signals:
- Price above both 20-day and 50-day SMAs
- MACD positive and bullish (reading: 1.86)
- 18.39% gain in 15 days showing real momentum
- Walking upper Bollinger Band (potential trend confirmation)
- Low Put/Call ratio of 0.19x (options market leans bullish)
- Short squeeze potential with 49M shares short
Bearish signals:
- Price below critical 200-day SMA ($156.55)
- RSI at 73.4 (overbought — historically precedes pullbacks)
- Overall multi-factor technical score rated “Bearish”
- -27% underperformance vs. S&P 500 over one year
- Volatility at 42.9% HV30 — above historical average of 31.6%
- DCF base case implies negative returns at current price
The verdict: QCOM’s technical setup is genuinely transitional. The near-term momentum is real — MACD and price action confirm it. But the overbought RSI, missing 200-day SMA reclaim, and benchmark underperformance prevent a clean “buy” signal. The April 29, 2026 earnings report is the catalyst that will likely determine QCOM’s technical trajectory for the rest of 2026.
For traders: wait for RSI cooling and/or a confirmed break above $156.55 before adding aggressively. For investors: the $125.35-$135.91 support range represents a more attractive risk/reward entry on any post-earnings pullback.
The analyst consensus price target of $150.10 (+0.8% from current prices) offers minimal cushion — Wall Street is essentially saying QCOM is fairly valued right here, with 29 analysts holding targets between $100 and $200. That wide dispersion alone tells you how much uncertainty still surrounds this stock.
Want to see whether this stock is still a buy at current levels? Run the full analysis to check fair value estimates, insider activity, technical signals, options positioning, support and resistance zones, and what analysts are expecting next in seconds.
Watch the earnings. Watch the 200-day SMA. And watch volume — it’s the one indicator that will tell you whether QCOM’s next move has conviction behind it.
If you want a complete Stock Analysis Report for QCOM stock – Try Tickzen Analyzer
This article is for informational and educational purposes only. Nothing in this analysis constitutes financial or investment advice. Past technical patterns do not guarantee future results. Always conduct your own research and consult a licensed financial advisor before making any investment decisions.
Comments
Join the discussion and share your view on this insight.
No comments yet. Be the first to contribute.